Environment
The Water Under the Map
An aquifer is a river with no banks, and a withdrawal from a decade that has not arrived yet
A well is not a tap on an infinite basement. It is a straw in a library of old rain.
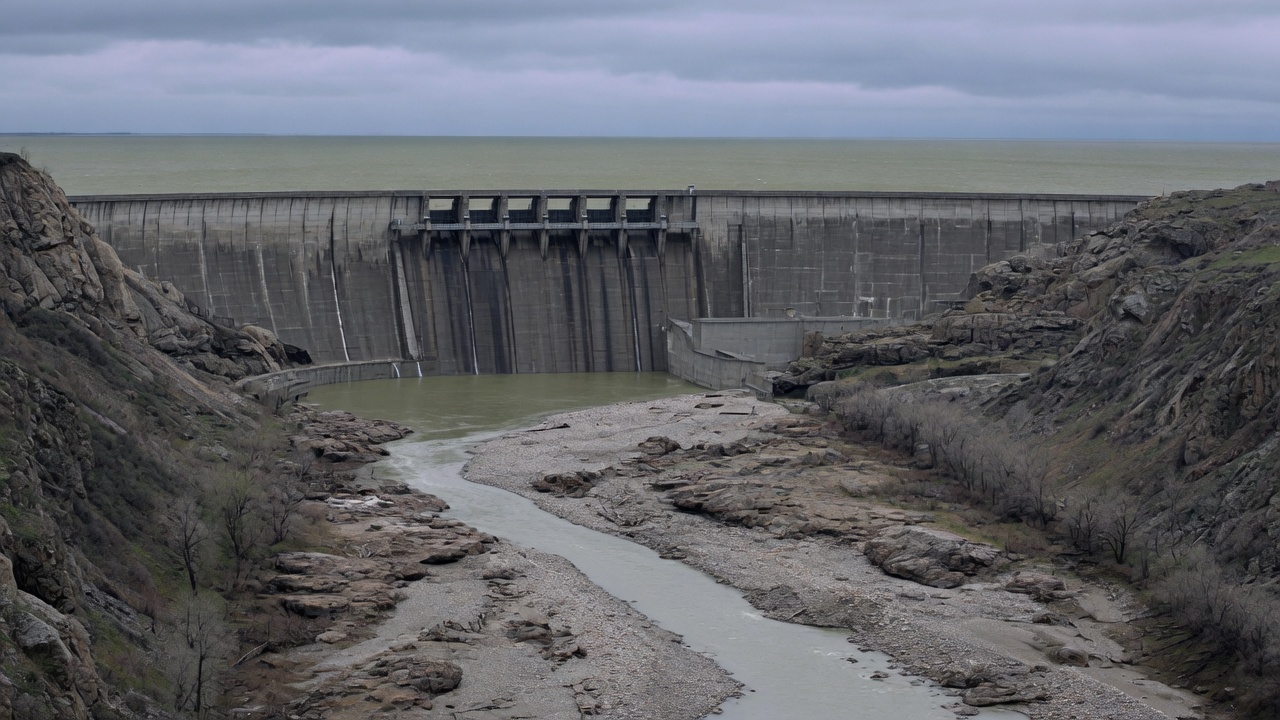
Maps show rivers because rivers have the courtesy to glitter. Aquifers do not. They are volumes of pore space in sand, gravel, silt, and rock, some of them refilled by this year’s snowmelt, some of them filled when the climate had a different name. A pump makes that volume look like a local convenience: a backyard, a pivot, a city’s second source. The delay between the pump and the consequence—the neighbor’s well, the compacted field, the salt in a coastal tap, the river that no longer meets the sea in late summer—is the part most people cannot easily see.
Hydrology is not mysterious about the direction. If extraction exceeds recharge, storage falls. What is mysterious, in ordinary civic life, is the lag. Water can still come out of a pipe while the clay a county away is compacting for good. Springs can fail after the orchard that caused them has changed hands. A coastal well can turn brackish because a freshwater head, unseen, no longer holds the sea back. This is established physics wearing the mask of a private backyard. It is also why “my well is fine” is not a basin diagnosis.
A library, not a basement
Groundwater is not an underground lake in the cartoon sense. It is water in the voids of a geologic formation, moving—often slowly—from places of recharge toward places of discharge: a spring, a stream, a wetland, a well. The travel time can be months in a coarse alluvial fan. It can be millennia in a deep confined sand. P. B. McMahon, J. K. Böhlke, and S. C. Christenson, sampling a transect of the central High Plains aquifer in southwestern Kansas, found radiocarbon ages that ran from less than about 2,600 years near the water table to about 12,800 years at the base of the aquifer. The unconfined aquifer held a stratified sequence of Holocene recharge. Paleorecharge temperatures for the oldest waters were cooler than for the newest. Nitrate in the old water looked like soil nitrogen; nitrate in recent recharge carried the signature of fertilizer and manure.
That is what “fossil” groundwater means when the word is used carefully. It does not mean the water is oil. It means the recharge that filled those pores happened under a climate, a vegetation, and a land use that are not the present ones, and that the rate at which new rain is replacing what is pumped is not the rate at which the pump is running. Some High Plains water is modern. Some is not. A well that still yields is not a proof that this year’s rain is doing the work.
Recharge itself is a local number. McMahon’s Kansas transect, calibrated with ages, was consistent with recharge on the order of 0.8 millimetres a year under loess and 8 millimetres a year under dune sand. Irrigation return flow can add a faster, dirtier recharge under a field. Native rangeland can add almost none. The map of the aquifer is not the map of the refill.
The High Plains account
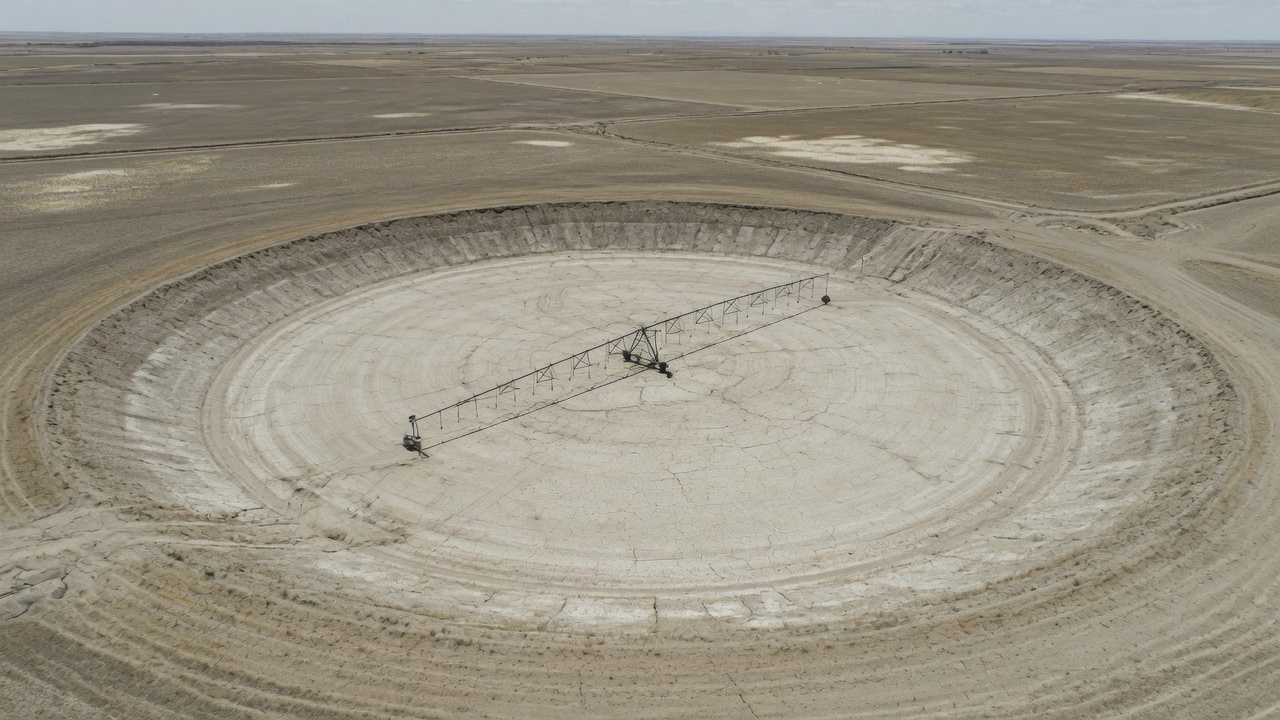
The High Plains aquifer—often called the Ogallala, though the Ogallala Formation is only part of the system—underlies about 175,000 square miles in parts of eight states: Colorado, Kansas, Nebraska, New Mexico, Oklahoma, South Dakota, Texas, and Wyoming. Substantial irrigation with groundwater began around 1950. Water-level declines began in parts of the aquifer soon after.
The U.S. Geological Survey has been publishing water-level-change reports for this aquifer, at Congress’s request, since 1988. Virginia McGuire and Kellan Strauch’s Scientific Investigations Report for predevelopment to 2019 is the recent public ledger. Water-level changes from predevelopment to 2019, well by well, ranged from a rise of 86 feet to a decline of 265 feet. The area-weighted average was a decline of 16.5 feet. Recoverable water in storage in 2019 was about 2.91 billion acre-feet, a decline of about 286 million acre-feet since predevelopment. From 2017 to 2019 the area-weighted average was a slight rise of 0.1 foot—weather and a couple of years, not a verdict.
Those averages hide the geography that matters. Nebraska, with the thickest saturated section and more recharge, has seen smaller average declines. Parts of southwestern Kansas and the Texas Panhandle have seen declines of hundreds of feet in individual wells. Saturated thickness that was once a comfort is, in some counties, a remaining stack of decades, not a remaining stack of centuries. Flying River will not invent a remaining-year count for “the Ogallala.” The remaining years vary by county, by well depth, by crop, and by whether the next decade is wet. A national magazine that prints a single countdown has mistaken a basin for a tank.
What does not vary is the direction in the heavily pumped southern and central counties: storage down, pumping still high, recharge not keeping up. K. F. Dennehy, D. W. Litke, and P. B. McMahon, writing two decades ago, already called the heavily used resource non-renewable in those portions where paleorecharge is being mined. The sentence has not expired.
The lag is the story
C. V. Theis, in 1940, described what a well does to a nearby stream. At first the water comes from storage around the well. With time, the cone of depression spreads until the well is capturing water that would have discharged to the stream, or is inducing the stream to leak into the aquifer. Eventually, in a connected system, the depletion of the stream approaches the pumping rate. The delay can be days if the well is in the floodplain. It can be years or decades if the well is far from the channel or the aquifer is sluggish.
Paul Barlow and Stanley Leake, in USGS Circular 1376, spent a report killing the folklore that grows up around this physics. Groundwater and surface water are not separate ledgers because a statute drew a line at the streambed. A well can dry a river without ever sitting in the river. The depletion may not appear at the gauge in the year the well was drilled. Turning the pump off does not restore the stream on the same schedule: the cone is already there, and it keeps capturing until the water levels recover, if they recover.
This is why a dry river is sometimes a groundwater story, and why a cheap crop is sometimes a mined ice-age rain. It is also why a city can congratulate itself on a full reservoir while the connected aquifer is being asked to make up the difference in a drought, and why the river’s fish do not attend the congratulation.
The lag has a civic use. It lets a generation pump. The next generation inherits a lower water table, a compacted clay, a salt front, or a legal fight. “My well is fine” is a statement about a straw. It is not a statement about the library.
When the ground itself becomes the receipt
If you take water out of a compressible aquifer, the grains can rearrange. Fine-grained beds—clays, silts—lose water from their pores and collapse. Some of that compaction is elastic and will rebound if levels recover. Much of it, once a previous maximum stress is exceeded, is inelastic. The storage those pores represented is gone. The land surface falls. Canals lose grade. Well casings protrude. Flood control channels hold less. The field is still there. It is lower, and it cannot be pumped back up.
The San Joaquin Valley is the textbook, and the textbook is still being written. Extensive groundwater withdrawal from unconsolidated deposits caused widespread aquifer-system compaction from the 1920s through about 1970, locally exceeding 8.5 metres. Importation of surface water through the Delta-Mendota Canal and later the California Aqueduct allowed pumping to ease, water levels to recover in some confined zones, and subsidence to slow. Drought and a return to groundwater reversed the relief. USGS work led by Michelle Sneed and colleagues measured, for 2008–2010, a 12,000-square-kilometre area of 25 millimetres or more of subsidence, with maxima of 540 millimetres south of El Nido and 345 millimetres west of Pixley. In the El Nido area, rates on the order of 270 millimetres a year during that interval were among the largest ever measured in the valley. Water levels in many deep wells reached historical lows. The subsidence was largely inelastic. The California Aqueduct and the Eastside Bypass have lost freeboard and flow capacity in the differential settlement. A canal is a precise object. A sinking valley is not.
Mexico City is the other public example, and it is not a rumor. The capital sits on former lake sediments. Groundwater has supplied a large share of its water for more than a century. Enrique Cabral-Cano and colleagues, and later InSAR studies by Estelle Chaussard and others, have measured subsidence rates of tens of centimetres a year in parts of the city—on the order of 30 to 40 centimetres a year in the fastest zones in some intervals, with accumulated lowering of many metres over the twentieth century. The Metropolitan Cathedral leans. Pipes break. The broken pipes waste water, which increases the demand that was already exceeding recharge. NASA’s more recent interferometry has continued to find centimetre-per-month rates in places, including near the airport. The mechanism is not exotic: pumping from a compressible aquifer under a heavy city. The rate is among the highest on Earth.
Compaction is the permanent part of overdraft. A water table can, in principle, rise. A collapsed clay will not re-inflate to take the same water again. That is why hydrologists speak of a loss of storage, not only of a loss of head.
Salt at the edge, a river in the middle
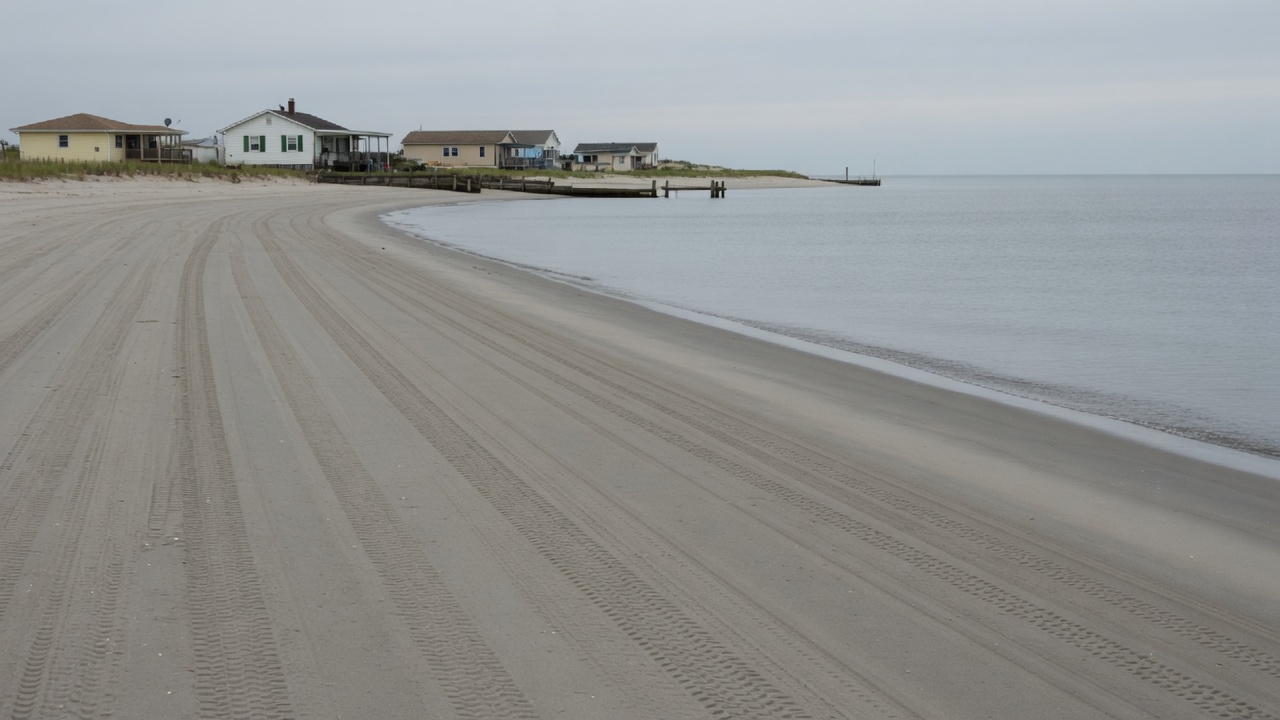
Along a coast, fresh groundwater and seawater share the pores. The freshwater, being lighter, tends to float on salt water, with a transition zone between. The position of that zone is a hydraulic balance. Lower the freshwater head—by pumping, by reduced recharge, by a rising sea—and the salt water moves inland and upward. Wells go brackish. The damage is not always reversible on a useful schedule: denser water that has entered a formation can be slow to flush.
Paul Barlow’s USGS Circular 1262 reviewed the Atlantic coast’s freshwater–saltwater environments: cones of depression, interface movement, the ordinary management tools of relocation, reduced pumping, and barrier injection. Scott Jasechko and colleagues, compiling some 250,000 coastal groundwater-level observations in the contiguous United States since 2000, found that a majority of observed groundwater levels lie below sea level along more than fifteen percent of the coastline, with landward hydraulic gradients common along substantial fractions of the East and Gulf Coasts and in heavily pumped parts of the West. Sea-level rise, coastal subsidence, and demand will not improve the arithmetic. California’s seawater-intrusion barriers in Los Angeles—injection wells holding a freshwater ridge against the Pacific—are an engineered admission of the same physics.
Inland, the connected stream is the quieter salt. Barlow and Leake’s point was not only about volume. A depleted stream is warmer, slower, less able to dilute what enters it, less able to keep a fish. The surface-water right and the groundwater right may sit in different offices. The fish sits in one river.
A statute that treats the delay as a subject
For most of American history, groundwater was the legal opposite of a flying river: too local, too private, too invisible to govern as a basin. California’s Sustainable Groundwater Management Act, signed in 2014, is a late, large exception, and it is worth describing as a governance response rather than as a miracle.
SGMA required local Groundwater Sustainability Agencies in high- and medium-priority basins to write plans that would bring basins to sustainability within twenty years of plan implementation—early 2040s for the first cohort. The Department of Water Resources was directed to identify basins in critical overdraft: basins where continuation of present practices would probably produce significant adverse overdraft-related impacts. Overdraft, in the statute’s hydrology, is extraction above the long-term average supply. The undesirable results the law named are the ones this article has been walking through: chronic lowering of levels, seawater intrusion, land subsidence, depleted storage, degraded quality, and depletions of interconnected surface water.
The San Joaquin Valley contains most of the state’s critically overdrafted agricultural basins. Plans were due first there. Some were approved, some found incomplete, some inadequate enough to risk state intervention. Implementation is a fight over pumping allocations, recharge projects, land fallowing, and who bears the cut. The Public Policy Institute of California has tracked a reduction in reported overdraft relative to earlier benchmark periods, alongside continued level declines in many wells, continued subsidence, and storage that does not fully rebound in a wet year. A law can rename a basin a public object. It cannot refill a compacted clay on a political timetable.
SGMA is not a template for the High Plains, which is eight states and a different legal patchwork. It is evidence that a society can decide, late, that a straw is not a property right in an infinite basement. Whether the decision arrives before the inelastic compaction and the salt front is the timing question the lag always sets.
What a basin diagnosis requires
We know the pathway. Rain and snow become recharge on a schedule the rock permits. Wells accelerate discharge. If the acceleration outruns the recharge, levels fall, streams shrink, coasts salinize, and compressible beds collapse. We often do not know, to the year, when a particular community will feel a particular pumping rate. Uncertainty about timing is not uncertainty about direction.
A well measurement is a point. A basin diagnosis is a network of points, a model of the rock, a record of pumping, and an admission that the river and the sea are in the same account. The neighbor whose well is still fine may be upgradient, or deeper, or lucky in a wet decade. The city whose tap is still cheap may be mining a library whose late fees will be paid in subsidence and treatment plants.
Follow the connection far enough and the map’s missing layer is time. The water under the map is already spoken for, including by people who have not been born, and including by the stream that does not vote. You don’t have to care about this because a drought headline told you to. You can care because a straw is a poor instrument for reading a library, and because the delay that makes the pumping easy is the same delay that makes the repair slow.
Sources
- McGuire, V. L., and K. R. Strauch. Water-Level and Recoverable Water in Storage Changes, High Plains Aquifer, Predevelopment to 2019 and 2017 to 2019. U.S. Geological Survey Scientific Investigations Report 2023–5143, 2024.
- McGuire, V. L. Water-Level and Recoverable Water in Storage Changes, High Plains Aquifer, Predevelopment to 2015 and 2013–15. U.S. Geological Survey Scientific Investigations Report 2017–5040, 2017.
- Gutentag, Edwin D., et al. Geohydrology of the High Plains Aquifer in Parts of Colorado, Kansas, Nebraska, New Mexico, Oklahoma, South Dakota, Texas, and Wyoming. U.S. Geological Survey Professional Paper 1400-B, 1984.
- McMahon, P. B., J. K. Böhlke, and S. C. Christenson. “Geochemistry, Radiocarbon Ages, and Paleorecharge Conditions along a Transect in the Central High Plains Aquifer, Southwestern Kansas, USA.” Applied Geochemistry 19, no. 11 (2004): 1655–1686.
- Dennehy, K. F., D. W. Litke, and P. B. McMahon. “The High Plains Aquifer, USA: Groundwater Development and Sustainability.” In Sustainable Groundwater Development, Geological Society, London, Special Publications 193 (2002): 99–119.
- Theis, C. V. “The Source of Water Derived from Wells: Essential Factors Controlling the Response of an Aquifer to Development.” Civil Engineering 10, no. 5 (1940): 277–280.
- Barlow, Paul M., and Stanley A. Leake. Streamflow Depletion by Wells—Understanding and Managing the Effects of Groundwater Pumping on Streamflow. U.S. Geological Survey Circular 1376, 2012.
- Barlow, Paul M. Ground Water in Freshwater-Saltwater Environments of the Atlantic Coast. U.S. Geological Survey Circular 1262, 2003.
- Jasechko, Scott, et al. “Groundwater Level Observations in 250,000 Coastal US Wells Reveal Scope of Potential Seawater Intrusion.” Nature Communications 11 (2020): 3229.
- Ireland, R. L., J. F. Poland, and F. S. Riley. Land Subsidence in the San Joaquin Valley, California, as of 1980. U.S. Geological Survey Open-File Report 82-370, 1982.
- Galloway, Devin L., David R. Jones, and S. E. Ingebritsen, eds. Land Subsidence in the United States. U.S. Geological Survey Circular 1182, 1999.
- Sneed, Michelle, Justin T. Brandt, and Mike Solt. Land Subsidence along the California Aqueduct in West-Central San Joaquin Valley, California, 2003–10. U.S. Geological Survey Scientific Investigations Report 2018–5144, 2018.
- Cabral-Cano, Enrique, et al. “Space Geodetic Imaging of Rapid Ground Subsidence in Mexico City.” Geological Society of America Bulletin 120, nos. 11–12 (2008): 1556–1566.
- Chaussard, Estelle, S. Wdowinski, E. Cabral-Cano, and F. Amelung. “Land Subsidence in Central Mexico Detected by ALOS InSAR Time-Series.” Remote Sensing of Environment 140 (2014): 94–106.
- California Department of Water Resources. California’s Groundwater (Bulletin 118), Interim Update 2016, and critically overdrafted basins list; Sustainable Groundwater Management Act, 2014 (Water Code §10720 et seq.).
- Public Policy Institute of California. Analyses of San Joaquin Valley overdraft and SGMA implementation, including Hanak et al., Water and the Future of the San Joaquin Valley (2019), and subsequent PPIC updates on overdraft and subsidence.
A well is not a tap on an infinite basement. It is a straw in a library of old rain.
Follow the connection
- Rain and snow
- Slow recharge
- Aquifer
- Well
- Delayed scarcity
What we know
- Groundwater is water stored in rock and sediment, recharged on timescales from seasons to millennia.
- Pumping can exceed recharge. The gap may not appear at the wellhead for years.
- Overdraft can lower water tables, dry springs, compact aquifers (permanent loss of storage), and draw in salt water along coasts.
- Surface streams are often connected to the water below; a “separate” groundwater right can still shrink a river.
What remains uncertain
- How fast a given basin will feel a given pumping rate depends on geology that is expensive to know well.
- Climate-shifted recharge is a moving number.
- Who is downstream of a well is a legal question as much as a hydrologic one.
What can we do?
You don't have to care about this because everyone else does. You can care because the evidence gives you a reason to.
- Read a water bill as a time machine: ask whose rain you are drinking.
- Support metering, recharge protection, and rules that treat connected surface water as connected.
- Be wary of “the well still works” as proof that the account is healthy.
Demonstration authors are fictional. The phenomena discussed are real subjects of public scientific literature and reporting. Sources named in the article are documented; this is not a comprehensive literature review.